Simple visuals for complex climate investment decisions
 Anna SandgrenCEO & Co-founder
Too many climate models & predictive scenarios are overly complex or very high-level without real grounding in data that make sense—making it impossible to turn insights into business action.
The problem?
❌ Excel files & data systems (LCA) that only experts can understand—blocking decision-making
❌ PowerPoints that oversimplify trade-offs—leading to poor investments
❌ Data silos or gaps that slow everything down—finance, procurement & sustainability all working separately with gaps on data to identify new innovations or sourcing
Unibloom fixes this with:
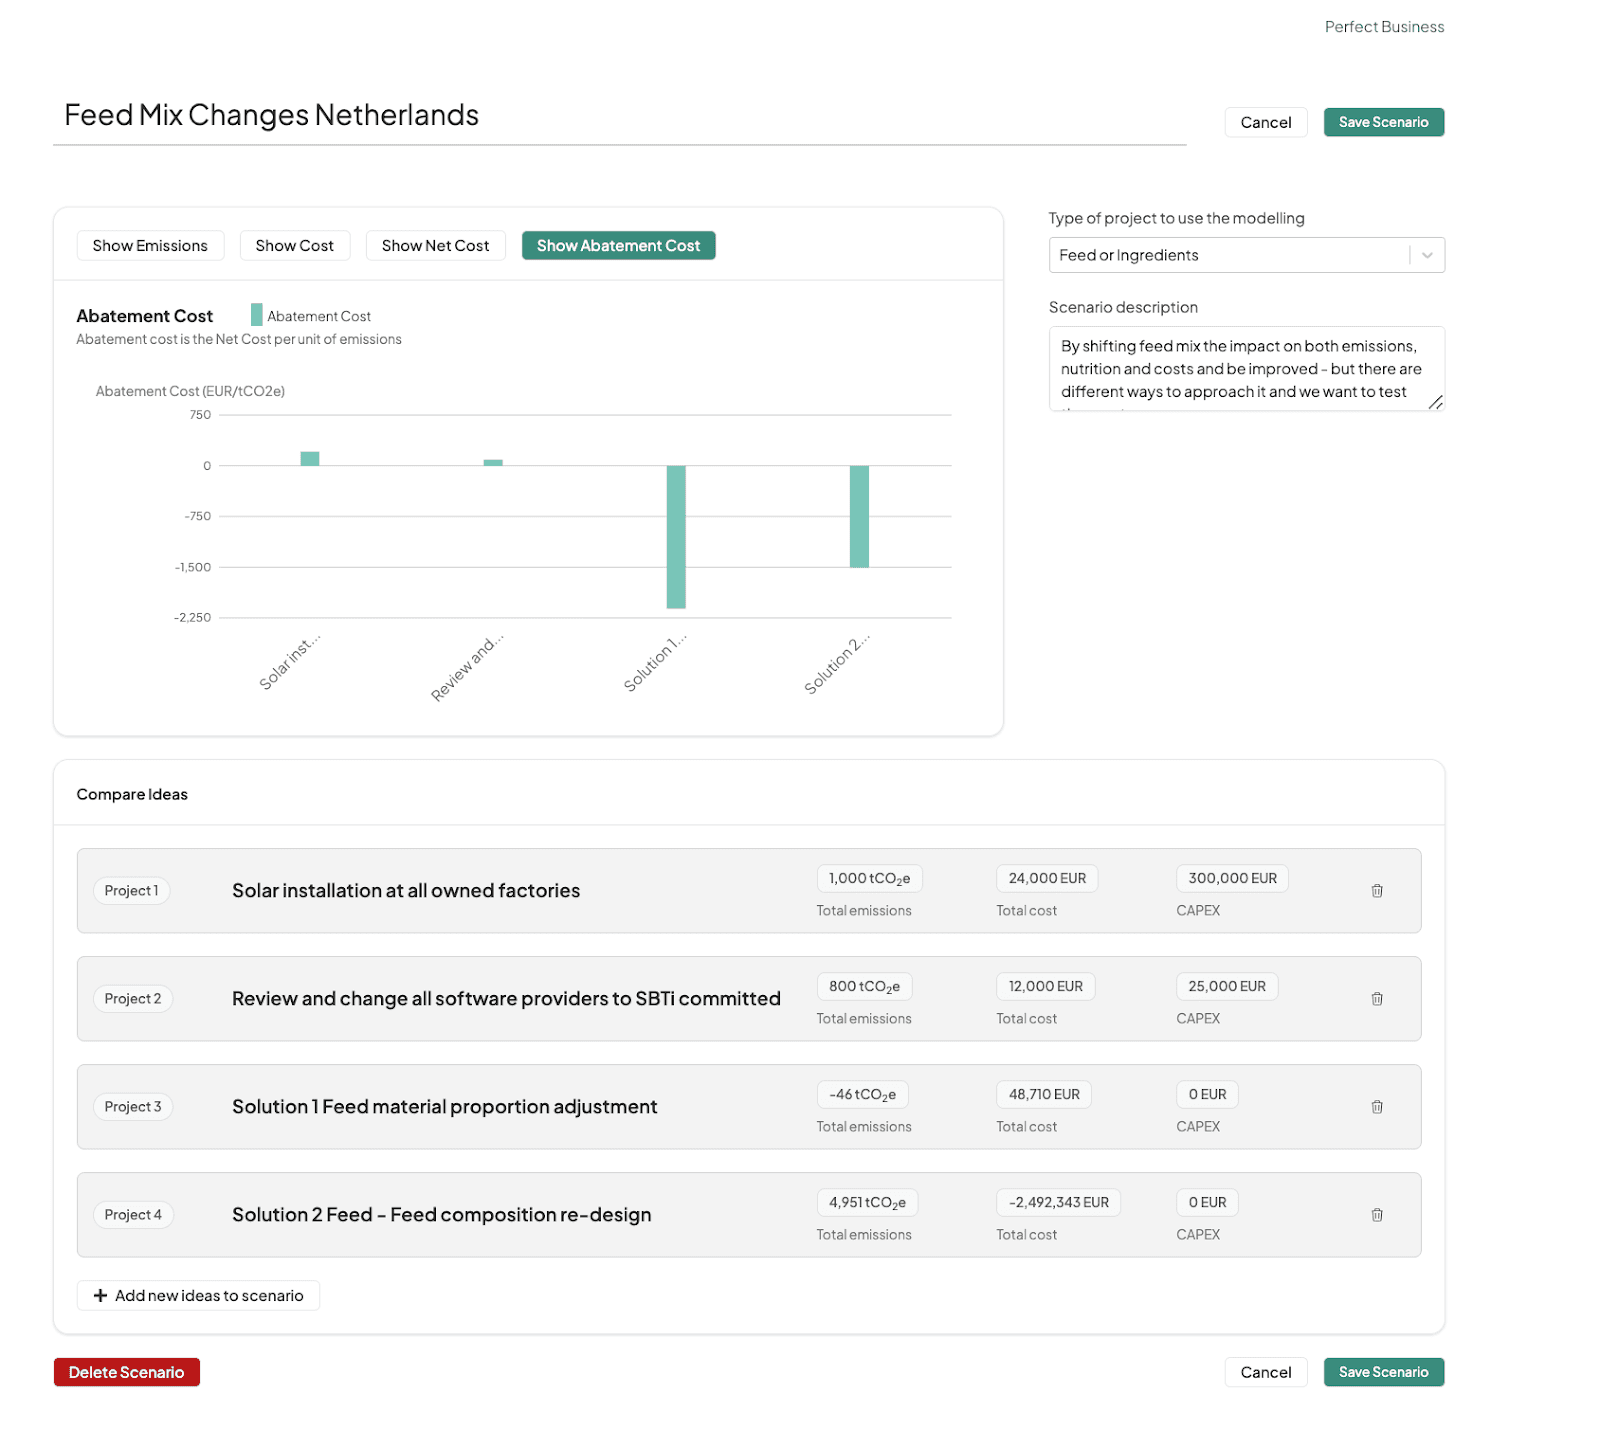
✅ Financial & climate impact in one view—see CAPEX, OPEX & CO₂ abatement curves side by side
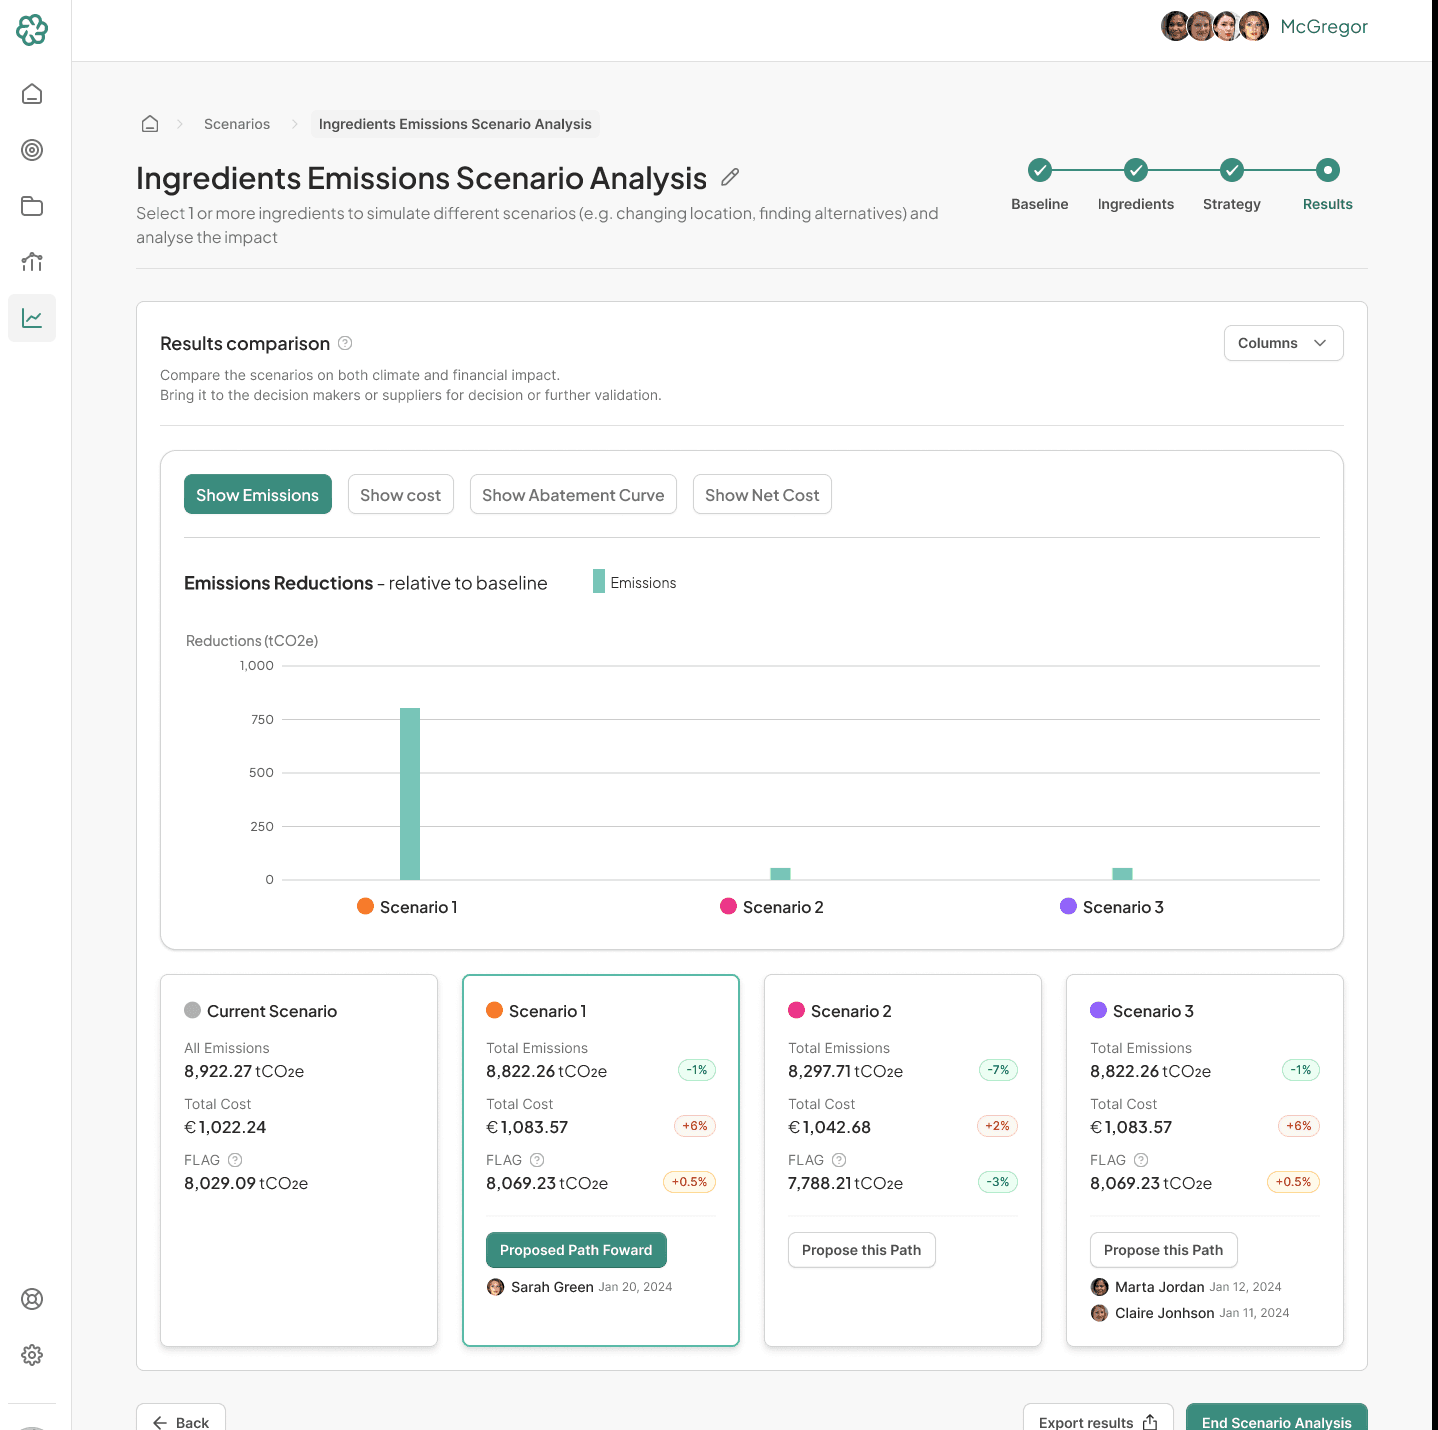
✅ Customisable dashboards—compare multiple scenarios at once, no manual work required
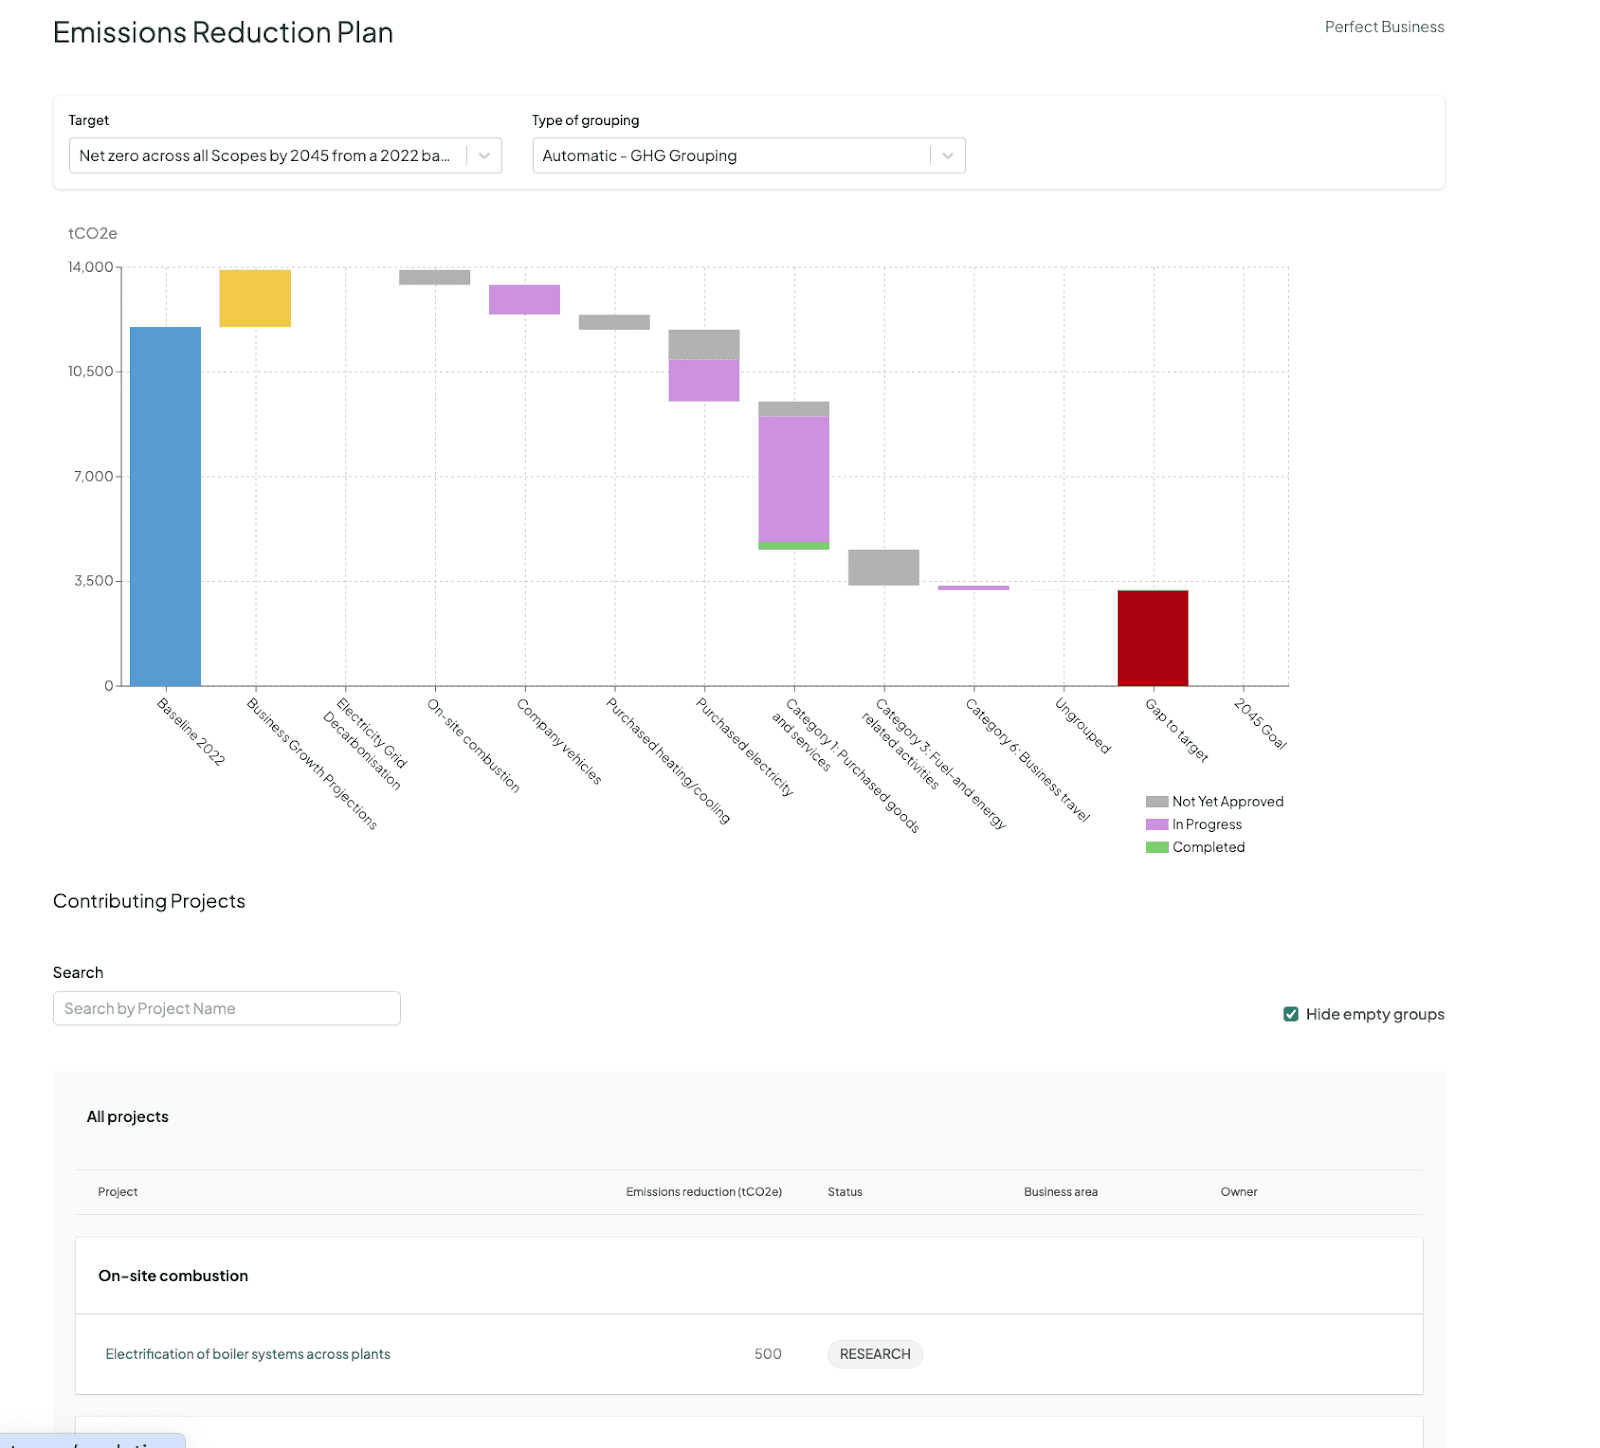
✅ Automatic benchmarking—track & predict decisions against SBTi or internal targets instantly
Visualise, compare & act—without drowning in data.
#DataDrivenDecisions #SustainableFinance #NetZero #CarbonReduction #SBTi